
Real time inventory synchronisation: the hardest consistency problem in ecommerce integration
Source of truth, out of order updates, available versus on hand, reservations, and the reconciliation loop that catches what events miss.
Read the articleShopify Integrations
Chatty query patterns, oversized payloads, bulk reads done one record at a time, webhook handlers doing too much, and the third party apps nobody measured.
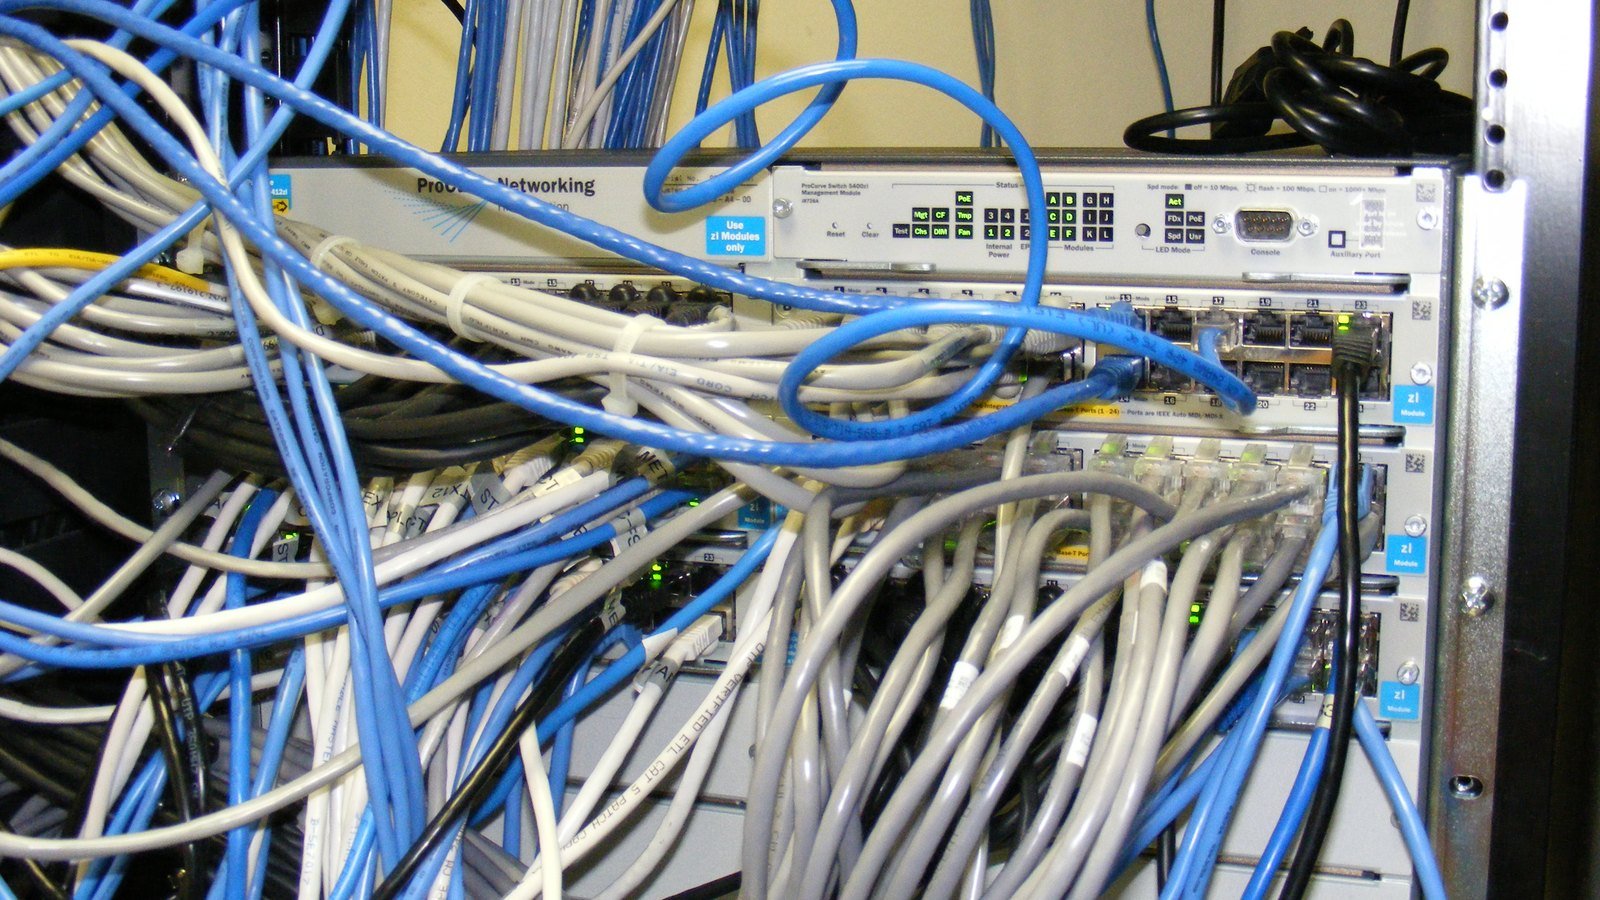
Shopify performance bottlenecks are rarely where people look for them. Teams profile their own code, find it reasonable, and conclude the platform is slow. The time is almost always going into the number of network calls being made, the size of what is being asked for, and work being done in places it should not be.
This is a tour of the ones that actually show up in connected stores, roughly in order of how often they are the cause.
Before chasing Shopify performance bottlenecks anywhere else, count requests. A job that takes twenty minutes and makes twelve thousand calls is not slow because of your code.
The classic pattern is a loop: fetch a list of orders, then for each order fetch its line items, then for each line item fetch the product. Three hundred orders becomes several thousand requests, each with its own round trip and each consuming limited capacity.
The fix is asking for related data together. A query that returns orders with their line items and the product fields you need, in one request, replaces the whole loop. This is the single largest improvement available in most integrations and it is usually a rewrite of one function.
Watch for the hidden loop. Sometimes the loop is not visible because it is inside a helper that looks like a simple lookup. A function called getProduct that runs inside a map over a thousand items is a thousand requests, and it reads like one line of code.
Measure before and after in requests, not seconds. Seconds vary with network conditions and with how busy the platform is. Request count is deterministic, and it is what you control.
The second of the common Shopify performance bottlenecks is fetching far more data than the job needs.
A sync that only needs the identifier, SKU and quantity of each variant, but requests the full product including descriptions, images, metafields and all variants, is moving many times the bytes it requires. On a few hundred products this is invisible. On a large catalogue, repeated every fifteen minutes, it is the dominant cost.
Request the fields you use and nothing else. This is the practical benefit of a query language where you name the fields: the saving is real and it compounds on every run.
Nested data has a cost too. Asking for products with every variant and every image, when you need one image, multiplies the response. Deeply nested queries are also more expensive against usage limits, so the cost lands twice.
Paginate at a sensible size. Very small pages mean many round trips. Very large pages mean slow individual responses and more to redo when one fails. There is a middle, and the default is not always it.
Among Shopify performance bottlenecks this one is self inflicted: exporting a large catalogue or a long order history by paging through it turns a job into an overnight process.
Shopify provides a bulk mechanism for exactly this: you submit the query, the platform assembles the result in the background, and you collect a file when it is ready. It is asynchronous, which feels less convenient, and on a large dataset the difference against paged reads is enormous.
Use it for anything whole catalogue. Initial loads, nightly full reconciliations, bulk price updates, large exports for reporting.
Keep paged reads for narrow, recent slices. Orders since a timestamp, products changed in the last hour. Those are small and interactive and paging is the right tool.
The design consequence is worth noting. If your architecture assumes a full refresh costs nothing and runs one every hour, the problem is not the mechanism, it is the assumption. Incremental updates driven by events, with a full reconciliation daily, is the shape that scales.
A handler that receives an event and then writes to three systems before responding creates Shopify performance bottlenecks with consequences beyond slowness.
Delivery expects a prompt response. A handler that takes several seconds because it is waiting on an ERP risks timing out, which means retries, which means duplicate deliveries, which means your downstream systems see the same event repeatedly while already under load.
The handler should persist and return. Write the payload somewhere durable, acknowledge, and let a worker do the processing. Receipt becomes fast and reliable regardless of what the downstream systems are doing.
Verification is not optional and it costs almost nothing. Check the signature before trusting the payload. It costs microseconds and it is the difference between a handler and an endpoint anyone can post to.
Watch for handlers that fan out. One event triggering three further API calls back to Shopify to gather context is a quiet multiplier: a busy hour of orders becomes four times the request volume, and that is frequently what pushes a store into throttling.
Installed apps are the least measured part of most stores and a frequent cause of Shopify performance bottlenecks on both the backend and the storefront.
They consume the same capacity you do. Several apps polling for changes on a schedule share the store’s limits with your integration. Your job is not slow in isolation; it is slow because four other things are asking at the same time.
They subscribe to webhooks. Each subscription is additional delivery traffic, and an app that is no longer used may still be subscribed and still be processing.
Some add storefront scripts. Which affects what customers experience rather than what your integration experiences, and it is measured differently; the published metrics are the reference for that side.
The audit is simple and rarely done. List what is installed, what each does, when it was last genuinely used, and what it costs in requests. Uninstalling three abandoned apps is often the fastest improvement available and it costs nothing.
Plenty of Shopify performance bottlenecks are not in Shopify at all: the integration is slow after the data arrives.
Row by row database writes. Inserting a thousand records one statement at a time, each in its own transaction, is slower than a batch by an order of magnitude. This is the commonest non platform cause.
Missing indexes on the lookup key. If every incoming order triggers a search for an existing record by the Shopify identifier and that column is not indexed, the check gets slower as the table grows, so the integration degrades over months rather than failing visibly.
Lock contention. Multiple workers updating the same stock rows block each other. More workers then makes it slower rather than faster, which is a confusing symptom if nobody suspects locking.
Serial processing of independent work. Thirty products that could be published concurrently being published one after another. Bounded concurrency, respecting the limits of whatever you are calling, is the fix.
Logging everything synchronously. Writing a verbose log line to disk or to a remote service inside the hot path adds up, and it is invisible because nobody profiles their logger.
Shopify performance bottlenecks get argued about because nobody has numbers. Four measurements end most of those arguments.
Requests per job. Count them. If it is thousands for hundreds of records, that is your answer before you look at anything else.
Time split between waiting and working. How much of the elapsed time is spent waiting on the network versus doing your own processing. These point at completely different fixes and teams routinely optimise the wrong one.
Remaining capacity during the run. If you are near the ceiling, the job is being slowed by throttling rather than by anything in your code. That is a different problem, covered in rate limit recovery strategies.
Queue age under load. If work is queued, the age of the oldest item during a busy period tells you whether you have enough throughput or are quietly falling behind.
Count requests per job and fix the worst loop. Trim the fields you request. Move whole catalogue reads onto the bulk mechanism. Get work out of webhook handlers and into a queue. Audit the installed apps. Then batch your database writes and index the lookup key. In most stores that sequence removes the large majority of Shopify performance bottlenecks before anybody has to think about infrastructure.
Related reading: designing highly available Shopify integrations covers the architecture that makes this resilient, circuit breaker patterns covers stopping retries from amplifying a problem, and real time inventory synchronisation covers the hardest case.
If a sync of yours is slow and you want a second opinion on where the time is going, tell us what it does and roughly how many records it touches.
Straight answers
Count the requests, not the seconds. Most slow integrations are slow because they make far more calls than they need, usually one per record where one call could have returned hundreds. Request count is the number that correlates with elapsed time.
It can be, for the right reason. Being able to ask for exactly the fields you need, and to fetch related data in one request rather than several, reduces both payload size and call count. Used carelessly it is slower, because a deeply nested query costs more than the simple one it replaced.
No. It should persist the payload and return. Any processing inside the handler adds latency to delivery, and a handler that is slow or failing affects how reliably you receive future events. Do the work in a worker reading from a queue.
Use the bulk mechanism rather than paging through records one page at a time. Paged reads of a large dataset are the classic mistake, and the difference between the two approaches on a big catalogue is measured in hours.
Frequently, and nobody measures them. Apps add requests, webhooks and sometimes storefront scripts. An audit of what is installed, what each one does and whether it is still used is often the quickest performance win available.
Sources
Fixed price, in writing
Got it. Your quote is being written now.
In business hours you will have it within 45 minutes. Check your inbox for the confirmation.
Keep reading

Source of truth, out of order updates, available versus on hand, reservations, and the reconciliation loop that catches what events miss.
Read the article
What each stage produces, which one overruns, and the handovers to insist on before paying the next invoice.
Read the article
Queues over direct calls, idempotency as a requirement, graceful degradation, and health checks that notice silence rather than errors.
Read the article